
If you work for a successful company, chances are a significant share of your wealth is tied up in your employer’s equity. This likely makes you wonder if you are better served diversifying out of your concentrated position. In this post, we use Modern Portfolio Theory to show why your employer’s stock has to have amazing prospects to justify maintaining a large position in it.
Modern Portfolio Theory in Reverse
In their Nobel Prize winning work on Modern Portfolio Theory (MPT), Harry Markowitz and Bill Sharpe provided a recipe for the construction of the ideal portfolio given an investor’s beliefs about asset returns and attitudes towards bearing risk. MPT states that one can construct an “efficient frontier” of optimal portfolios offering the maximum possible expected return for every given level of risk. These portfolios can be calculated using mean-variance optimization.
For the purpose of this post, instead of using mean-variance optimization to start with an investor’s risk preferences and beliefs about the returns of available investments to compute the optimal portfolio mix, we will start with the investor’s risk preferences and portfolio mix and back solve for the expected returns of the investments that justify the portfolio as optimal.
To illustrate this reverse optimization approach (described in detail in the Appendix at the bottom of the post) we consider an investor who allocates her portfolio between a single company’s stock and a broad equity index. We use the S&P 500 as the broad equity index in our example to simplify exposition, although historically the investor would have been able to achieve a superior risk-adjusted return by diversifying her portfolio across a range of asset classes (e.g. US stocks, foreign stocks, real estate, bonds, etc.). For the single company stock component, we consider two cases: owning mature companies and young, post-IPO, tech companies. The set of “mature” companies is assumed to include all companies that were members of the S&P 500 at any point during the last 20 years; the set of “young” companies includes 258 technology companies that had IPOs from 1990 to 2012 (we stopped at 2012 so that we’d have enough data on post-IPO performance).
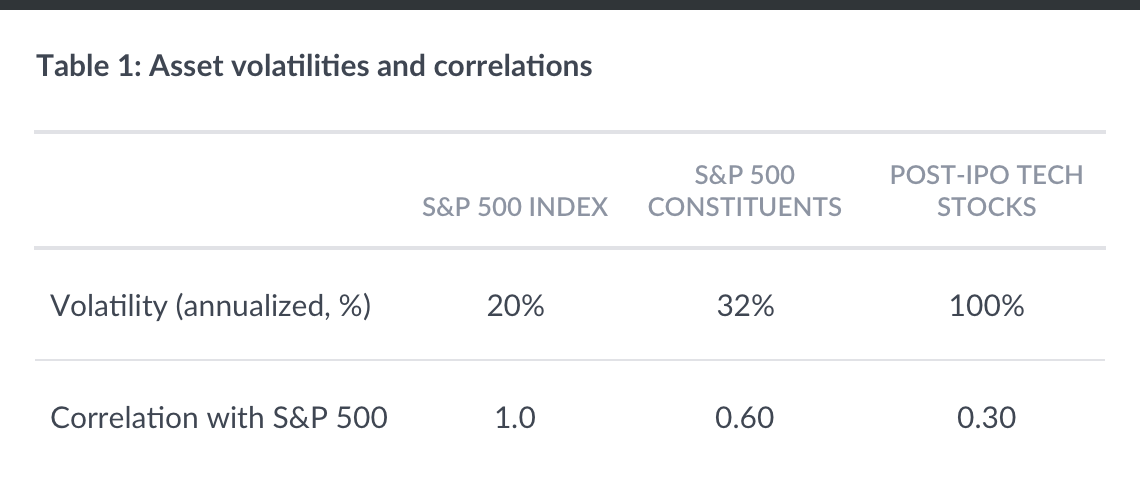
To apply mean-variance optimization, we need to specify the risk-free rate, the volatilities associated with each investment, the correlations between the investments, and the investor’s risk tolerance. We set the risk-free rate of return (rf) equal to 1.0% and the annualized equity index volatility to 20% (matching the annualized volatility of the daily S&P 500 index returns over the last 20 years).
An analysis of historical daily returns for the individual “mature” companies over the same period (January 1, 1997 to December 31, 2016) reveals an average annualized return volatility of 32%, and a correlation of 0.60 with the S&P 500 index. The fact that the historical index volatility is significantly below the average volatility of the constituents is an immediate testament to the benefits of diversification. The corresponding values for young, tech companies – measured in the four years following their IPO – are an average annualized volatility of 100% and a correlation of 0.30 with the S&P 500. Unsurprisingly, the young tech companies are meaningfully riskier, and their prospects less correlated with aggregate economic outcomes. Finally, to pin down the investor’s risk tolerance, we assume that an expected return of 6% per year on the equity index, would induce the investor to allocate 100% of their wealth to just the equity index.
We next calculate what the expected returns must be for each investment in order for the portfolio to be optimal for our hypothetical investor at different allocations (w) to the single company stock. For example, w = 20% means 20% of the portfolio is in invested in the single company stock and 80% in the equity index. Table 2 displays the expected amount by which the single stock must “beat” the equity index per year in order to justify the concentrated allocation.
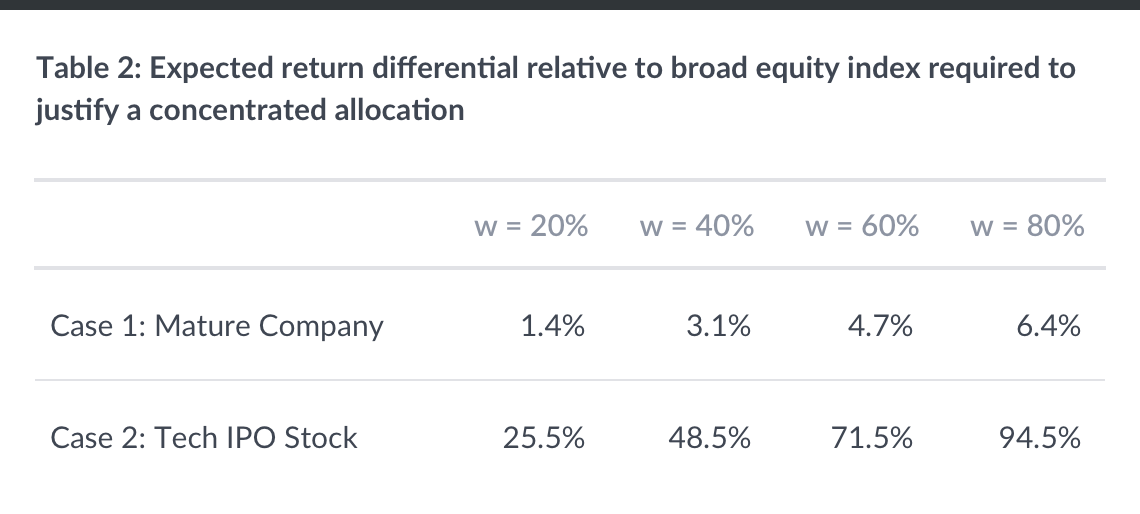
Justifying a concentrated allocation to a mature company requires a meaningful margin of expected outperformance to compensate the investor for the additional risk they are taking. The difference in expected returns increases as the concentration of the company stock increases, from 1.4% per year at a 20% portfolio allocation to 6.4% per year at an 80% allocation. While these values seem modest, bear in mind that even professional investors do not come remotely close to reliably beating the market by such margins. In fact, the data reliably demonstrate that active investors underperform their passive brethren.
In the case of an investor whose portfolio is concentrated in the stock of a post-IPO tech company, rather than a mature company, the required margin of outperformance rises significantly. For example, to justify holding 60% of her portfolio in a young tech stock and 40% in the S&P 500, the investor must expect the stock to outperform the S&P 500 by a staggering 71.5% per year. That is not a terribly likely scenario.
The Historical Evidence
To provide context for how unlikely it would be for you to earn the kind of outperformance required to justify ownership of a concentrated position in your company stock, we examine the returns of individual stocks relative to the S&P 500 index using historical data. To illustrate the relative performance, we compute the value of a $1 investment in a single stock and scale it by the value of a $1 investment in the S&P 500 over the same period. A ratio greater than one indicates the stock has outperformed the index, and a value less than one indicates the stock has underperformed.
Mature Companies
For the mature companies, we examine the four year performance of all companies which were members of the S&P 500 at some point between 1997 and 2012. Specifically, we look at the four year performance of each company starting on its date of inclusion, or an anniversary of its inclusion, so long as it remained a member of the index. This gives us roughly 7,500 four-year relative performance histories (~500 constituents x 15 years). Figure 1 plots the median, 25th-percentile, and 75th-percentile of the performance of the individual stock divided by the performance of the S&P 500 at each month in the four year window.
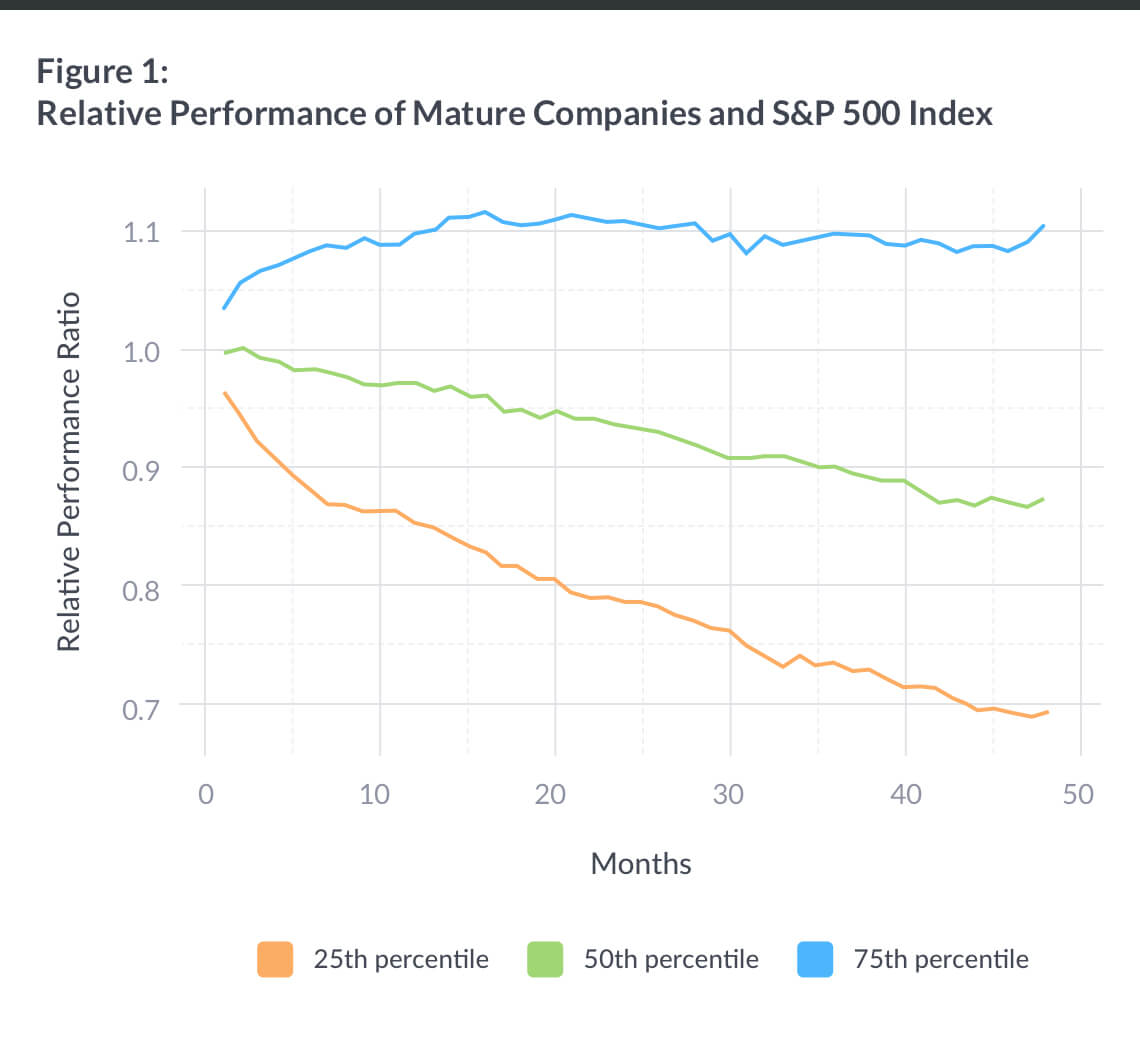
The historical data show that the median company in the sample underperformed the broad index by roughly 2.5% at the one-year horizon, 5% at the two-year horizon, and by over 10% at the four-year horizon.
IPO Stocks
For the tech IPO sample, we compute the investment performance of each of the 258 IPO companies over the four year period following their lockup expirations (commonly six months after IPO), divided by the performance of the S&P 500 index over the same time period. Figure 2 plots the median, 25th-percentile, and 75th-percentile of the relative performance ratio at each point in the four year window.
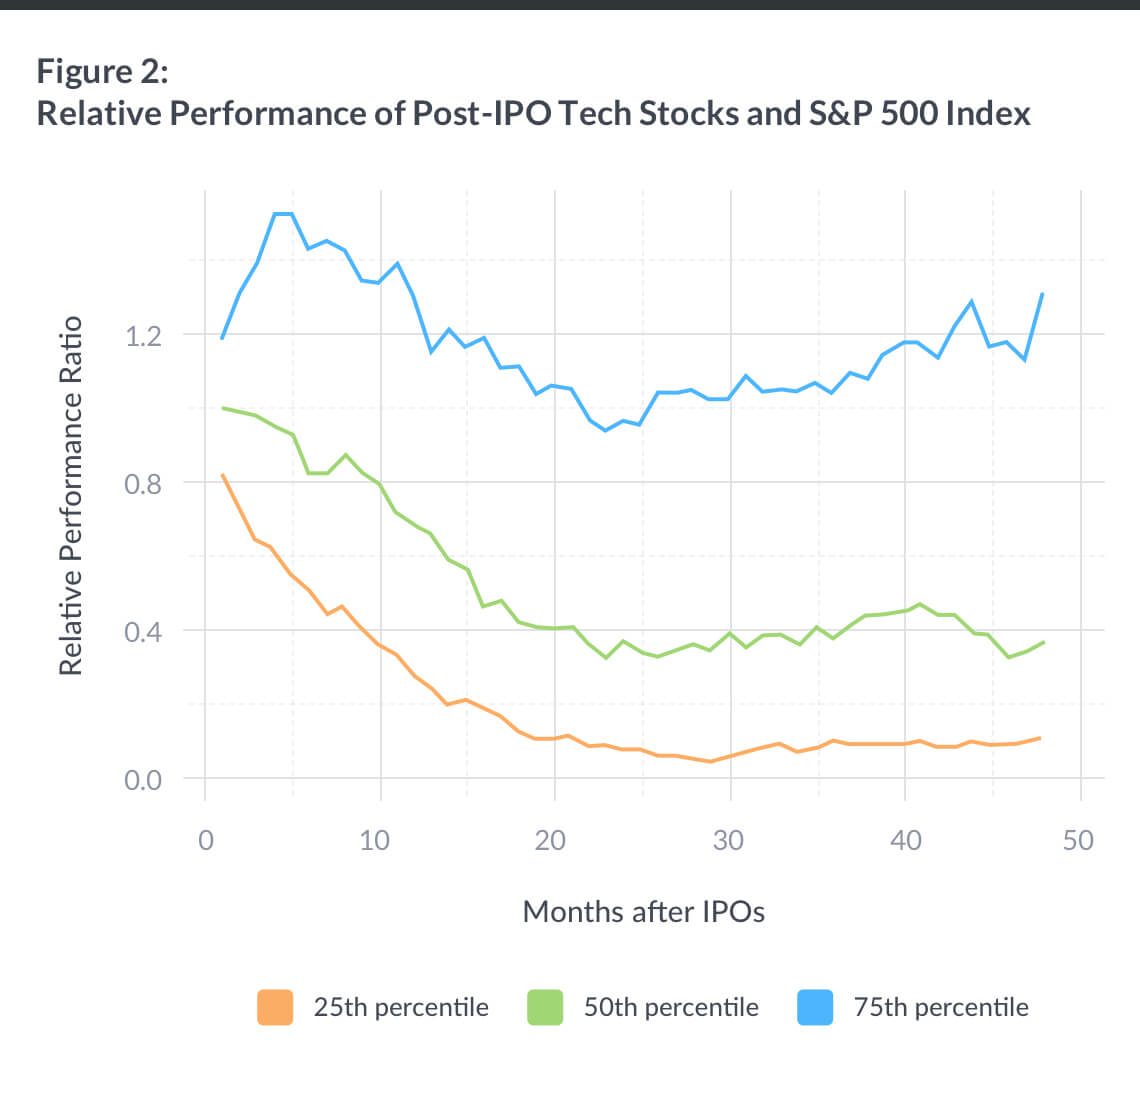
Figure 2 illustrates that the median IPO stock underperforms the S&P 500 index by over 20% during the first year following the IPO, and by almost 60% after two years. Even the top quartile of IPOs barely keeps pace with the S&P 500 after two years. While this evidence does not rule out the possibility of outperformance, it clearly indicates this has been the exception rather than the norm.
What does this imply about your concentrated position?
Unless you are confident your company stock can significantly outperform (and in the case of tech companies, very significantly outperform) the S&P 500 then you are far better off diversifying at least some portion of your concentrated company stock position. Selling your stock ratably minimizes the regrets you might feel about selling your stock all at once and might be the only way you can bring yourself to do what’s in your best interest.
Appendix
The Reverse Optimization Approach
A basic version of the mean-variance optimization problem, without borrowing or short-sale constraints, involves maximizing the following investment criterion with respect to the investor’s investment allocation, ω, an (N x 1) vector of portfolio weights:
max (μ – rf)’ * ω – 1 / (2 * riskTolerance) * (ω’ * Σ * ω)
where μ is an (N x 1) vector of expected returns on the assets, and Σ is the (N x N) variance-covariance matrix. Intuitively, the investor maximizes the expected excess return on the portfolio (first term) subject to a penalty for the portfolio variance (second term), with the penalty depending on the investor’s risk tolerance (i.e. a more risk tolerant investor applies a smaller penalty for portfolio risk). The solution to this problem is a portfolio:
ω = (riskTolerance) * Σ-1 * (μ – rf)
To implement the reverse optimization approach, we take the investor’s portfolio weight vector (ω), risk tolerance, as well as, the variance-covariance matrix (Σ), and solve for the expected returns (μ) that would justify the supplied portfolio allocation:
μ = rf + 1 / riskTolerance * Σ * ω
For our two asset example, we have: μ = [μindex, μstock]’, ω = [1 -wstock, wstock]’, and the terms in Σ are determined by the volatility of the stock index (σindex), the volatility of the stock (σstock), and their correlation (ρ). Furthermore, the riskTolerance parameter can be substituted out based on the assumption that the investor would be fully invested in the index at an expected rate of return, μindex*. Setting ω = [1, 0], reflective of a portfolio fully invested in the equity index, we obtain:
μindex* = rf + 1 / (riskTolerance) * (σindex)2
Using this result to solve for the risk tolerance parameter, we arrive at an expression for the difference in expected rates of return on the stock and the broad equity index:
μstock – μindex = (μ* – rf) * [ ( ρ * σstock / σindex – 1) * (1 – wstock) + ((σstock)2 / (σindex)2 – ρ * σstock / σindex) * wstock]
Disclosure
Nothing in this blog should be construed as tax advice, a solicitation or offer, or recommendation, to buy or sell any security. This blog is not intended as investment advice, and Wealthfront does not represent in any manner that the circumstances described herein will result in any particular outcome. Investment advisory services are only provided to investors who become Wealthfront clients. For more information please www.wealthfront.com or see our Full Disclosure.
While the data Wealthfront uses from third parties is believed to be reliable, Wealthfront does not guarantee the accuracy of the information.Backtested and/or hypothetical performance is NOT an indicator of future actual results. Backtested results are calculated by the retroactive application of a model constructed on the basis of historical data and based on assumptions integral to the model which may or may not be testable and are subject to losses. Backtested results are adjusted to reflect the reinvestment of dividends and other income and do not reflect any deduction for investment management fees.
Wealthfront assumed we would have been able to purchase the securities recommended by the model and the markets were sufficiently liquid to permit all trading. Backtested performance is developed with the benefit of hindsight and has inherent limitations. Specifically, backtested results do not reflect actual trading or the effect of material economic and market factors on the decision-making process. Actual performance may differ significantly from backtested performance. There is a potential for loss as well as gain that is not reflected in the hypothetical information portrayed. Investors evaluating this information should carefully consider the processes, data, and assumptions used by Wealthfront in creating its historical simulations.
The S&P 500® (“Index”) is an index of 500 stocks seen as a leading indicator of U.S. equities and a reflection of the performance of the large cap universe, made up of companies selected by economists. The S&P 500 is a market value weighted index and one of the common benchmarks for the U.S. stock market. The S&P 500 (“Index”) is a product of S&P Dow Jones Indices LLC and/or its affiliates and has been licensed for use by Wealthfront. Copyright © 2015 by S&P Dow Jones Indices LLC, a subsidiary of the McGraw-Hill Companies, Inc., and/or its affiliates. An rights reserved. Redistribution, reproduction and/or photocopying in whole or in part are prohibited Index Data Services Attachment without written permission of S&P Dow Jones Indices LLC. For more information on any of S&P Dow Jones Indices LLC’s indices please visit www.spdji.com. S&P® is a registered trademark of Standard & Poor’s Financial Services LLC and Dow Jones® is a registered trademark of Dow Jones Trademark Holdings LLC. Neither S&P Dow Jones Indices LLC, Dow Jones Trademark Holdings LLC, their affiliates nor their third party licensors make any representation or warranty, express or implied, as to the ability of any index to accurately represent the asset class or market sector that it purports to represent and neither S&P Dow Jones Indices LLC, Dow Jones Trademark Holdings LLC, their affiliates nor their third party licensors shall have any liability for any errors, omissions, or interruptions of any index or the data included therein.
About the author(s)
Jakub Jurek is Wealthfront’s VP of Research. Jakub's research expertise spans theoretical and empirical asset pricing, and includes topics related to portfolio management, alternative investments, credit risk, market microstructure, as well as, currencies. His work has been published in peer-reviewed journals including the Journal of Finance, the Journal of Financial Economics, and the American Economic Review. Jakub has held academic appointments at the Bendheim Center of Finance at Princeton University, and The Wharton School at the University of Pennsylvania. Jakub holds an undergraduate degree in Applied Mathematics and a Ph.D. in Business Economics, both from Harvard University. Prior to entering graduate school, he worked in the quantitative equity strategy groups at Goldman Sachs and AQR Capital Management, LLC. He has also served as a consultant to Grantham, Mayo, van Otterloo, LLC, and the Harvard Management Company. Celine Sun is Wealthfront’s Director of Research. She works on a wide range of projects and in-depth quantitative data analysis. She applies her econometric expertise to developing and improving investment strategies and research infrastructure. Celine earned her PhD in Financial Economics from the University of Washington and BS in Mathematics from the University of Science and Technology of China. She is a CFA charterholder and member of the CFA Society of San Francisco. View all posts by Jakub W. Jurek, PhD and Celine Sun, PhD, CFA