Our clients sometimes ask us how often they should change their risk tolerance score. The answer is: Not often. You won’t be surprised to find that the question comes up most frequently when the markets are either up big or down big.
Human nature leads us to want to increase our risk tolerance when we experience an up market and decrease our risk tolerance in down markets. Like most everything in investing, what feels right seldom is.
There are a few good reasons to change your risk tolerance but there are also bad reasons that you should learn to recognize and avoid.
Good Reasons: Significant Financial Changes
There are several significant events that can change your risk tolerance:
- A major life change
- A significant increase (or decrease) in your liquid net worth
- A significant increase (or decrease) in your income
Your tolerance for risk as a single individual might be very different from what your new spouse might find appropriate. It’s important to find a compromise that fits both parties (please see Couples Investing: How To Determine Risk Tolerance for more help on this topic). The birth of a new child will also likely cause you to lower your tolerance for risk. Finally, most people tend to get more risk averse as they age, but that change happens slowly, and can be revisited every five years or so.
The greater your excess income, the more risk you are able to take. Meaning if you receive a large bonus at work, receive an inheritance or have some other significant boost to your liquid net worth (and keep your spending the same) you are able to accommodate a higher level of risk in your investment portfolio. Conversely, it makes sense to reduce your risk tolerance if you experience a reduction in your net worth or income because you have less excess income or assets with which to safely invest.
Bad Reasons: Market Timing
Even the best-intentioned investors can’t help but try to time the market. You might not realize it, but changing your risk tolerance in reaction to market performance is an unconscious form of market timing. It’s a common human reaction to want to lower your tolerance for risk after you have incurred a loss, just as it is a common reaction to raise your tolerance for risk after benefiting from a gain. This is exactly the opposite of what you should do.
Lowering your risk tolerance results in the sale of securities with the highest volatility. These are likely the securities that have suffered the biggest loss when markets decline. A properly rebalanced portfolio implements the opposite behavior — buying securities that suffered the biggest loss and selling the biggest winners — because rebalancing is a form of forced contrarianism.
Contrarians usually make the best investors. That’s because they know over the long run most investment returns revert to the mean — winners in one year are seldom the winners in the next (we explain this in detail in Why You Shouldn’t Just Invest in the S&P 500®). So buying the biggest losers and selling the biggest winners leads to higher returns. Acting contrarian is incredibly hard to execute because it’s counter to human nature. It just doesn’t feel right to buy losers. You need to be very strong emotionally to pull it off. That’s the beauty of the Wealthfront service. We do it for you.
Lessons from Wealthfront Data
At Wealthfront, we see evidence of both types of risk tolerance change. The number of risk tolerance changes due to market volatility is small, but it’s still visible in the data.
Frequency of risk score changes as compared to the S&P 500®
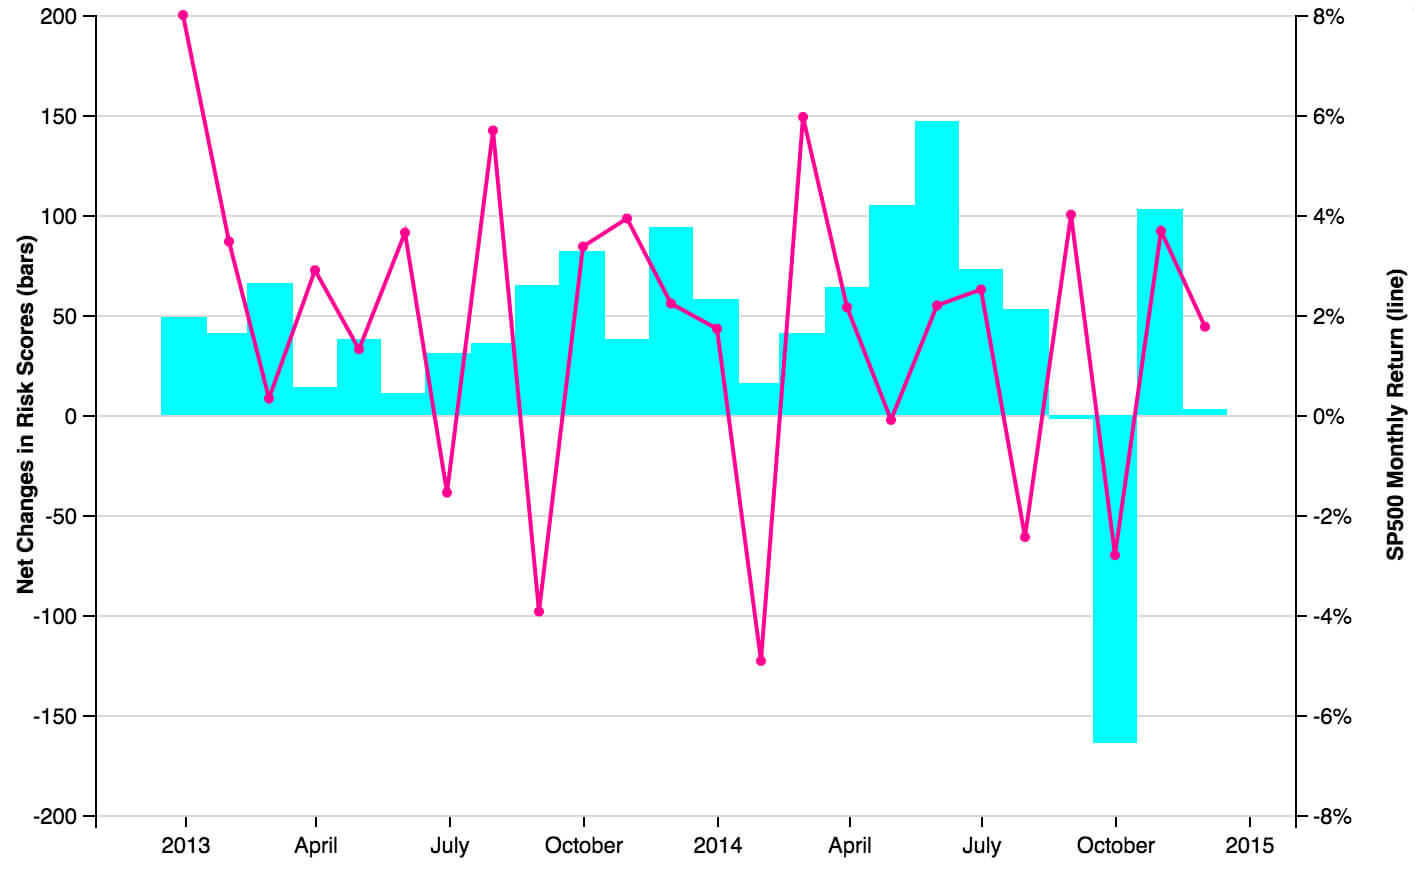
Blue bars indicate net change in risk score (left Y axis; positive numbers indicate increases in level of risk while negative indicate instances of lowered risk tolerance) versus the Monthly S&P 500 monthly return (red line; right Y axis)
You can clearly see there are more risk score increases when the market performs well and more decreases when the market performs poorly. These relationships are statistically significant.
Mutual fund flows plotted against market performance
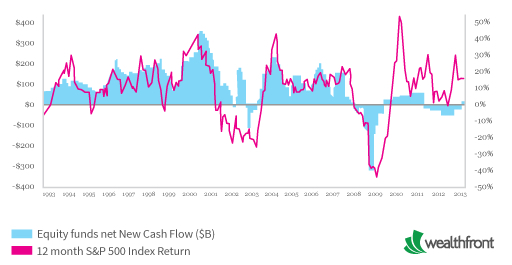
This chart looks almost exactly like the risk score behavior we see from our clients (which fortunately is a very small subset of our overall client base).
Our clients’ risk score change behavior is especially profound considering the effort we make to keep people from doing the wrong thing. Our software limits our clients to one risk-score change per month. We encourage people who attempt more than three risk-score changes over the course of a year to try another investment manager. We do this because people who change their risk score frequently are unlikely to be satisfied over the long term with our philosophy of rebalancing rather than changing risk scores in the midst of a volatile market. Keep in mind our service will periodically ask our clients to review their risk tolerance and, if it remains high as you approach retirement the service will begin to suggest gradual decreases to your risk score over time to insure less volatility by the time you intend to retire.
Find Your Score AND Stick to It
Research has clearly and consistently shown that attempting to time the market leads to lower returns than a periodically rebalanced diversified portfolio of low-cost index funds. Unfortunately most people don’t realize that changing their risk tolerance is no different than trying to choose when to invest more money or withdraw funds.
When it comes to investing, slow and steady wins in the long run.
Disclosure
The S&P 500 (“Index”) is a product of S&P Dow Jones Indices LLC and/or its affiliates and has been licensed for use by Wealthfront. Copyright © 2015 by S&P Dow Jones Indices LLC, a subsidiary of the McGraw-Hill Companies, Inc., and/or its affiliates. An rights reserved. Redistribution, reproduction and/or photocopying in whole or in part are prohibited Index Data Services Attachment without written permission of S&P Dow Jones Indices LLC. For more information on any of S&P Dow Jones Indices LLC’s indices please visit www.spdji.com. S&P® is a registered trademark of Standard & Poor’s Financial Services LLC and Dow Jones® is a registered trademark of Dow Jones Trademark Holdings LLC. Neither S&P Dow Jones Indices LLC, Dow Jones Trademark Holdings LLC, their affiliates nor their third party licensors make any representation or warranty, express or implied, as to the ability of any index to accurately represent the asset class or market sector that it purports to represent and neither S&P Dow Jones Indices LLC, Dow Jones Trademark Holdings LLC, their affiliates nor their third party licensors shall have any liability for any errors, omissions, or interruptions of any index or the data included therein.
About the author(s)
Andy Rachleff is Wealthfront's co-founder and Executive Chairman. He serves as a member of the board of trustees and chairman of the endowment investment committee for University of Pennsylvania and as a member of the faculty at Stanford Graduate School of Business, where he teaches courses on technology entrepreneurship. Prior to Wealthfront, Andy co-founded and was general partner of Benchmark Capital, where he was responsible for investing in a number of successful companies including Equinix, Juniper Networks, and Opsware. He also spent ten years as a general partner with Merrill, Pickard, Anderson & Eyre (MPAE). Andy earned his BS from University of Pennsylvania and his MBA from Stanford Graduate School of Business. View all posts by Andy Rachleff