Most investors know that for every level of risk there exists a portfolio that maximizes their returns. However, many overestimate their ability to assess their own risk tolerance.
For every level of risk there exists a portfolio that maximizes your return. This optimal set of portfolios is known as the “Efficient Frontier” and can be identified using a technique called Modern Portfolio Theory (MPT). Not surprisingly, the creators of MPT won a Nobel Prize for their work in 1990. Since then, MPT has become the basis on which the vast majority of investment advisors, including Wealthfront, have built their portfolios. Once you identify the Efficient Frontier, all you have to do is determine the investor’s risk tolerance to choose the portfolio that’s the right match.
There’s only one problem. Unlike returns, which can easily be expressed in percent terms, risk tolerance is somewhat intangible; it’s as much psychology as statistics. It’s thus very difficult for an individual to quantify her tolerance for risk. That makes it difficult for most people to apply the Efficient Frontier concept to their personal circumstances.
The Efficient Frontier is usually expressed as a graph like this one, showing that the greater the risk you’re willing to take, the greater is your potential return. (Risk measurement, for the MBAs out there, is related to the standard deviation of the portfolio’s return.)
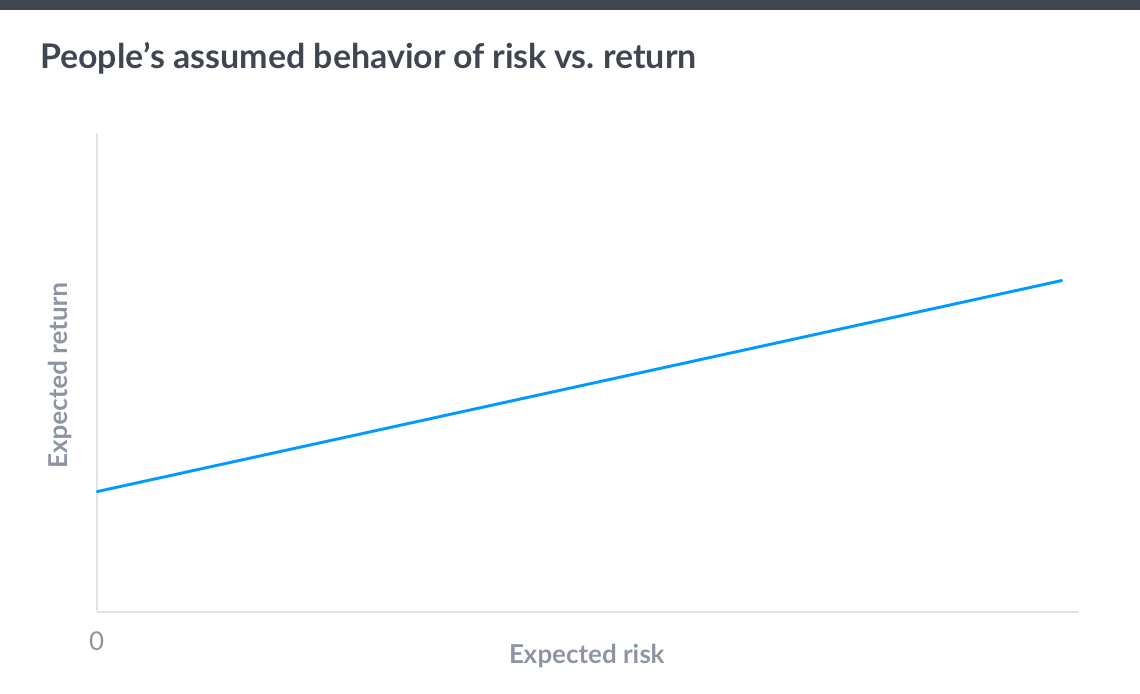
Over the past five years I have given a seminar on “Investing Well” to over 100 companies. After I display the Efficient Frontier, I am almost always asked, “If that graph represents my potential set of opportunities, why wouldn’t I always choose the portfolio represented at the far right of the Frontier, the one with the highest return?”
That seems like a reasonable question. But it assumes everyone can truly tolerate the maximum level of risk. In fact, people consistently underestimate their aversion to risk, professing to be able to deal with it when they actually react very poorly to it. DALBAR, a prominent financial services research firm, has been studying this problem for over 40 years. Each year they publish an estimate of the amount of money individual investors lose through the same stupid behavior – buying when markets rise and selling when markets decline, which is clear evidence of being risk-averse. Amazingly, DALBAR has consistently found that individual investors on average lose 3.52% more than they would have if they just let their portfolios be.
This number doesn’t change even as market conditions do because, as we have pointed out many times in this blog, nothing about good investing feels right. It just doesn’t feel right to sit on the sidelines when your investments decline in value. Better to run for the exits before things get worse. However the opposite behavior, buying on declines and selling when the market rises, would actually lead to better returns. Unfortunately, as our Chief Investment Officer Burt Malkiel loves to point out, it’s almost impossible to time the market, so you are better off just letting your investments ride and rebalance when they get out of line.
But that’s really hard to do if you have a portfolio with more expected volatility than that with which you may be comfortable. Therefore a portfolio at the far right hand side of the Efficient Frontier is likely only appropriate for an incredibly small subset of the population.
Frequent readers of our blog know that I revere Howard Marks, both for his investment acumen and his ability to explain investing in simple terms. A few weeks ago I had the pleasure of having lunch with Howard before he taught a class at Stanford Graduate School of Business. The topic for his session was assessing risk, and as usual he had a simple but brilliant way of explaining why most people get it wrong.
He observed, consistent with the questions I’ve heard in my seminars, that most people think of the Efficient Frontier as a line – which leads them to want the highest-performing portfolio. What they don’t realize is that actual investment outcomes represent a series of potential distributions around the line. The amount of volatility around the line is small at the far left of the Frontier and increases as the line moves up and to the right (see chart below):
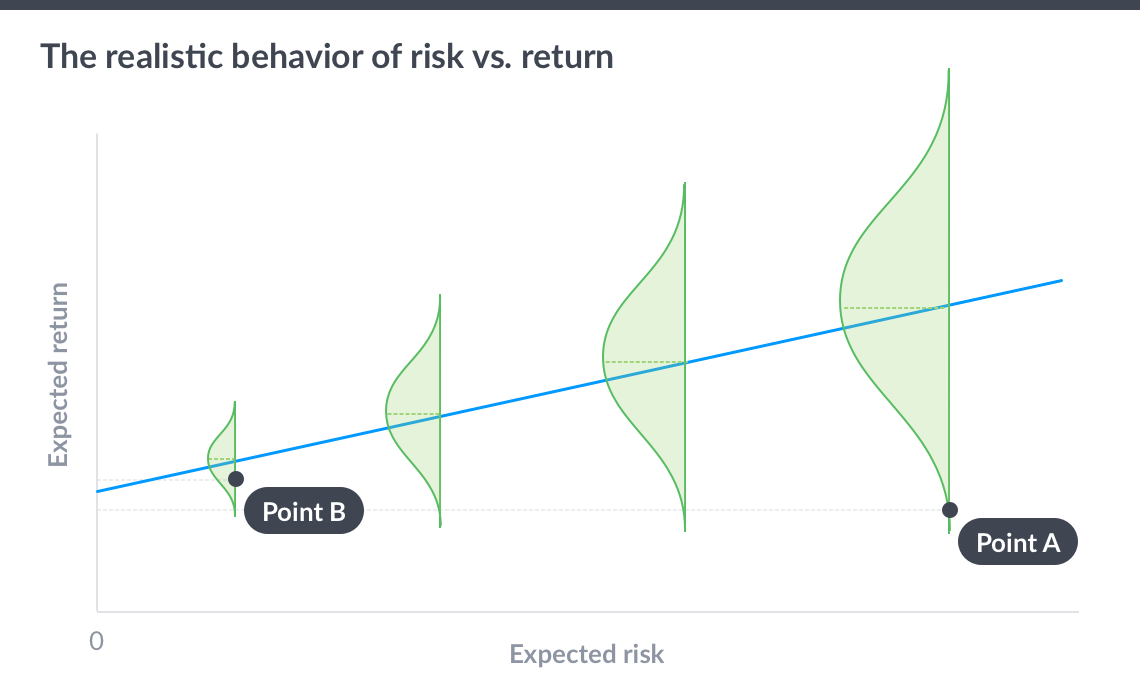
As you can see there is a very reasonable chance that the return at Point A could be significantly below the return of an investment at Point B, which technically represents a lower expected risk level. When viewed from this context, it becomes clearer that the far right hand part of the Efficient Frontier is not always as attractive as it might first appear.
At Wealthfront, we go to great lengths to determine what your true risk tolerance might be so that we can invest your money in a portfolio that you won’t abandon when the market declines. That alone could add more than 3% to your annual return! We realize our questionnaire may look like what others offer, but in fact there is a great deal of sophisticated behavioral economic theory at work under the covers. (Please read our Investment Methodology White Paper for more details on how our risk questionnaire works). Our questionnaire is yet one more example of the tremendous work our investment research team does to try to build the best investment service possible.
Disclosure
Nothing in this blog should be construed as tax advice, a solicitation or offer, or recommendation, to buy or sell any security. This blog is not intended as investment advice, and Wealthfront does not represent in any manner that the circumstances described herein will result in any particular outcome. Graphs and other images are provided for illustrative purposes only. While the data Wealthfront uses from third parties is believed to be reliable, Wealthfront cannot ensure the accuracy or completeness of data provided by clients or third parties. Investment advisory services are only provided to investors who become Wealthfront clients. For more information please visit www.wealthfront.com or see our Full Disclosure.
About the author(s)
Andy Rachleff is Wealthfront's co-founder and Executive Chairman. He serves as a member of the board of trustees and chairman of the endowment investment committee for University of Pennsylvania and as a member of the faculty at Stanford Graduate School of Business, where he teaches courses on technology entrepreneurship. Prior to Wealthfront, Andy co-founded and was general partner of Benchmark Capital, where he was responsible for investing in a number of successful companies including Equinix, Juniper Networks, and Opsware. He also spent ten years as a general partner with Merrill, Pickard, Anderson & Eyre (MPAE). Andy earned his BS from University of Pennsylvania and his MBA from Stanford Graduate School of Business. View all posts by Andy Rachleff