When it comes to investing, doing the right thing is usually counter-intuitive. A prime example we’ve written about before is how investing in down-markets can actually prove advantageous. This is because down markets give investors an opportunity to purchase more than they would be able to afford in an up market (See Invest Despite Volatility). We’ve also written about how individual investors find it difficult to invest rationally and tend to make mistakes by following their intuition, piling in while the market goes up and liquidating as the market goes down. This is otherwise known as timing the market. Burton Malkiel, our Chief Investment Officer views this as often being an investor’s Most Serious Mistake.
But something we haven’t quantified before is how much investors might actually suffer from engaging in this type of behavior. In this post we calculate how much investors can lose by reacting to market conditions — or equivalently, how much they can gain by staying the course.
A Case of Two Portfolios
Specifically, we will compare returns for two hypothetical investors: Sandhya and Bob. They both start with $100,000 to invest, but invest their subsequent equivalent savings differently. Sandhya doesn’t pay attention to the market and invests an additional $10,000 every quarter regardless of what the market does, while Bob has his eyes glued to his returns and invests an additional $10,000 only in quarters in which his total investment return to date is positive. When Bob misses a quarterly deposit because his account is down, he keeps the cash in his checking account and invests only when his investment return is positive once again.
We simulated returns for a Wealthfront taxable portfolio that replicates our average client’s risk tolerance (risk score of 7 on a scale of 0 to 10). You can see the portfolio’s investment mix below:
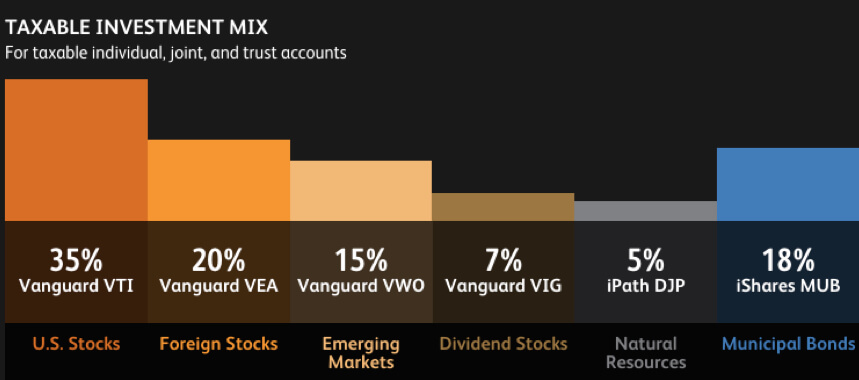
We began the hypothetical portfolios in 2000 and simulated them using historic returns to the end of 2014, a period of 15 years. Over the fifteen-year period, Sandhya and Bob each invest a total of $690,000.
The chart below shows the timing of deposits for each portfolio as compared to the performance of the S&P 500®.
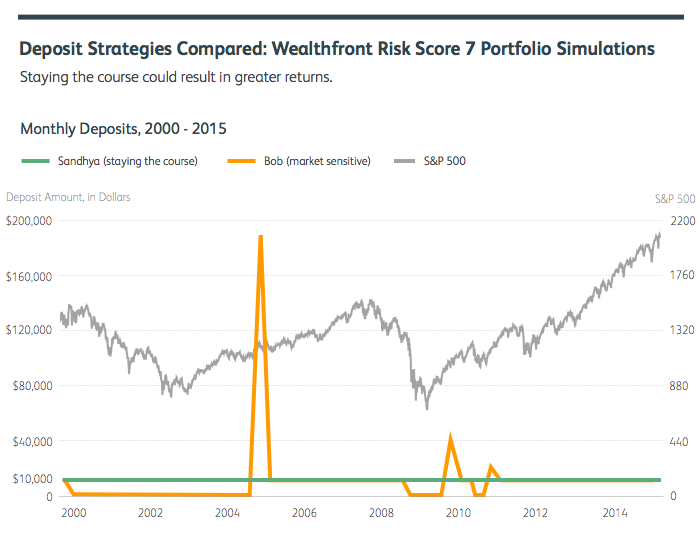
As you can see, Sandhya’s deposits are consistent each quarter, while Bob’s deposits are erratic and follow the market (represented in the chart by the S&P 500). Bob skips incremental deposits entirely from mid 2000 through late 2004, and his deposits follow a similar cycle following the crash of 2008.
In the graph below, Sandhya’s regular deposits, despite the poor market conditions, begin to separate her portfolio value from Bob’s within four years and from that point on the disparity grows larger.

Even with the severe downturn of 2008, which affects both portfolios, Sandhya’s portfolio rebounds to a greater degree than Bob’s and stays ahead throughout the remaining five years.
Steady and Stubborn Wins the Race
By the end of 2014, Sandhya’s account is worth $77,000 more than Bob’s, despite having invested the same amount.
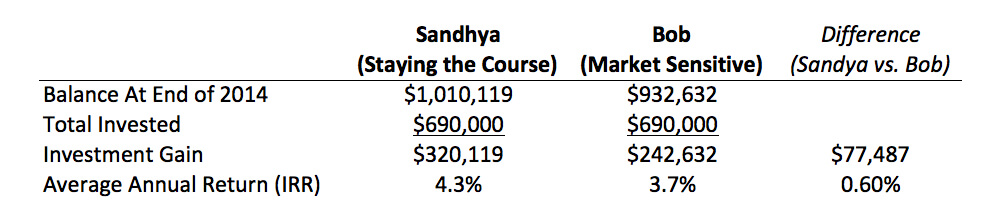
Sandhya’s decision to ignore the market and consistently invest new savings regardless of performance allowed Sandhya to buy more with her money, which increased her overall investment performance by 0.60% per year. Through the magic of compounding, that extra 0.60% in annual investment performance is a big win — a $77,000 win, in fact — when compounded over 15 years.
The lesson here is reminiscent of one made by Charley Ellis, well-known author, founder of Greenwich Associates and member of our advisory board in his post Too Much Liquidity Will Cost You Over the Long Run. He makes the point that every investor can always come up with reasons to be optimistic or pessimistic about market conditions, but the truth is that the market cannot be predicted and that history has shown it is better to be in the market than out. As Charley writes, having your money in cash instead of invested for just 10 of the best market days between 1994 and 2013 would have wiped out nearly half of the total return from the S&P 500 over those 20 years.
Stay the Course
DALBAR, an investment research firm that has been analyzing individual investor behavior for more than 20 years, has consistently found the average individual loses approximately 4% per year based on buying and selling at the wrong times. In its analysis DALBAR found that individual investors tended not only to not buy when the market was down, rather individual investors tended to sell — which, is the absolutely worst thing they could do. Selling in down markets rather than not buying increases the aforementioned 0.60% annual deficit to a 4% incremental loss.
It takes courage to continue investing independent of market conditions. And as we discussed in There’s No Need to Fear Stock Market Corrections, history shows that courage is often rewarded because it doesn’t take that long for corrections to rebound — the mean time to recovery over the last 50 years has been only 107 days.
Committing to or automating your deposit schedule is the best way to ensure that you avoid attempting to time the market or let your emotions or paralysis get in the way and stick to your long-term plan — you’ll thank yourself one day.
Disclosure
Nothing in this blog should be construed as tax advice, a solicitation or offer, or recommendation, to buy or sell any security. Financial advisory services are only provided to investors who become Wealthfront Inc. clients pursuant to a written agreement, which investors are urged to read carefully, that is available at www.wealthfront.com. All securities involve risk and may result in some loss. For more information please visit www.wealthfront.com or see our Full Disclosure. While the data Wealthfront uses from third parties is believed to be reliable, Wealthfront does not guarantee the accuracy of the information.
Several processes, assumptions and data sources were used to create one possible approximation of how making consistent deposits into a Wealthfront account might have benefited investors in the past, and a different methodology may have resulted in different outcomes. Hypothetical performance is not an indicator of future actual results. Hypothetical results are calculated by the retroactive application of a model constructed on the basis of historical data and based on assumptions integral to the model which may or may not be testable and are subject to losses.
Wealthfront assumed we would have been able to purchase the securities recommended by the model and the markets were sufficiently liquid to permit all trading. Hypothetical performance is developed with the benefit of hindsight and has inherent limitations. Specifically, hypothetical results do not reflect actual trading or the effect of material economic and market factors on the decision-making process. Actual performance may differ significantly from hypothetical performance. There is a potential for loss as well as gain that is not reflected in the hypothetical information portrayed. Investors evaluating this information should carefully consider the processes, data, and assumptions used by Wealthfront in creating its historical simulations.
Hypothetical results are adjusted to reflect the reinvestment of dividends and other income and, except where otherwise indicated, are presented net of fees. The projected returns consider dividend reinvestment, and interest but do not take into consideration the effect of taxes, changing risk profiles, or future investment decisions. Projected returns do not represent actual accounts and may not reflect the effect of material economic and market factors.
The S&P National Municipal (“Index”) is a product of S&P Dow Jones Indices LLC and/or its affiliates and has been licensed for use by Wealthfront. Copyright © 2015 by S&P Dow Jones Indices LLC, a subsidiary of the McGraw-Hill Companies, Inc., and/or its affiliates. All rights reserved. Redistribution, reproduction and/or photocopying in whole or in part are prohibited Index Data Services Attachment without written permission of S&P Dow Jones Indices LLC. For more information on any of S&P Dow Jones Indices LLC’s indices please visit www.spdji.com. S&P® is a registered trademark of Standard & Poor’s Financial Services LLC and Dow Jones® is a registered trademark of Dow Jones Trademark Holdings LLC. Neither S&P Dow Jones Indices LLC, Dow Jones Trademark Holdings LLC, their affiliates nor their third party licensors make any representation or warranty, express or implied, as to the ability of any index to accurately represent the asset class or market sector that it purports to represent and neither S&P Dow Jones Indices LLC, Dow Jones Trademark Holdings LLC, their affiliates nor their third party licensors shall have any liability for any errors, omissions, or interruptions of any index or the data included therein.
About the author(s)
Duncan Gilchrist is a member of Wealthfront’s research team, where he leverages insights from data and behavioral economic theory to improve Wealthfront’s products. He holds a PhD in Business Economics, an AM in Economics, and an AB in Applied Mathematics, all from Harvard University. Davis Janowski is Wealthfront's editor. Before joining Wealthfront he was most recently technology columnist for InvestmentNews; prior to that he served in various roles with PC Magazine including editor, analyst and reviewer. He holds a Master of Arts degree in magazine journalism from the S.I. Newhouse School of Public Communications at Syracuse University. View all posts by Duncan Gilchrist, PhD & Davis Janowski