
One of the biggest challenges for an investor is to determine how well her diversified portfolio is performing. The two most common benchmarks featured in published advice are:
- S&P 500
- A 60/40 Stock/Bond portfolio
Unfortunately, most published advice is incorrect. That’s because it usually encourages comparison to an irrelevant index or too generic of a model portfolio. In our opinion, the right way to benchmark a diversified portfolio is to take into account risk and taxes.
Let’s Start with Indexes
Most individual investors think they should benchmark their diversified portfolios against a stock index like the S&P 500®. That’s probably because such indexes are the only indexes with which they are familiar or the only indexes their financial advisors used in the past. Most financial news outlets repeatedly report on the Dow Industrials Average and the S&P 500, so those two must be the best indexes to use, right?
These US equity indexes were created to be used as benchmarks for US public equity managers who attempt to outperform the market, not for diversified portfolios. A US stock index has a slightly higher expected return and significantly higher expected volatility (risk) than a well diversified portfolio. Using a stock index as a benchmark for a diversified portfolio is like comparing apples to oranges. The only fair way to compare the two types of investments is on a risk adjusted return basis.
Evaluating Risk: Enter the Sharpe Ratio
William Sharpe, the co-recipient of the Nobel Prize awarded for the creation of Modern Portfolio Theory (the method by which we and the vast majority of financial advisors determine an optimal asset allocation), helped solve this problem by creating the Sharpe Ratio to evaluate the risk adjusted return of dissimilar investment opportunities. It is calculated as follows:
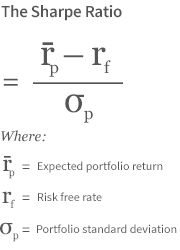
The Sharpe Ratio for the S&P 500 over the past 15 years was 0.23. In contrast the Sharpe ratio over the past 15 years for a hypothetical moderate risk portfolio diversified across six asset classes (similar to Wealthfront) would have been 0.34. That means a common diversified portfolio could have outperformed the S&P 500 by almost 50% on a risk adjusted return basis (See disclosures at the bottom of the post).
Sharpe ratios are used extensively by institutional investors to evaluate the performance of their portfolios. Unfortunately most individual investors are not familiar with the Sharpe Ratio and are therefore conditioned to evaluate their portfolios’ performance solely on return rather than risk AND return. As a result a number of other lower fidelity approaches have been created to help benchmark diversified portfolios.
The Traditional Approach
The most common approach to benchmarking diversified portfolios is to compare a client’s portfolio to a portfolio that consists of 60% stocks and 40% bonds. This is commonly referred to as the “60/40” portfolio. Typically the S&P 500 is used for the stock component and the Barclays Aggregate Bond Index for the bonds. The benefit of this approach is it contemplates some diversification, but it fails to consider risk and taxes (two of the most important investment issues).
In their Nobel Prize winning work on Modern Portfolio Theory, Harry Markowitz and Bill Sharpe showed that one’s tolerance for risk should be the primary driver of one’s investment mix. As you can see from the chart below there exists a maximum return for every level of risk as defined by volatility.
The line that connects the maximum returns for every level of risk is known as the Efficient Frontier. Numerous research studies have shown that it can only be achieved through the optimal allocation of asset classes, not through security selection. As you can see the “60/40 portfolio” only represents one level of risk and isn’t even on the efficient frontier (because its expected return is not the maximum expected return for a diversified portfolio with that particular level of expected risk).

Comparing a portfolio with one particular level of risk is not appropriate for investors who might have another risk tolerance. For example, an investor with significant risk tolerance (say an 8 on Wealthfront’s 10 point scale) should expect both a higher return than a 60/40 portfolio and greater volatility over long periods of time.
Benchmarks Don’t Include Taxes, But Taxes Matter
Almost every discussion I have read on the topic of portfolio performance ignores the impact of taxes. This is likely due to the difficulty of adjusting a benchmark for your particular tax rate. At Wealthfront we attempt to maximize your net of fee, after-tax risk adjusted return (as should every advisor). That usually implies the use of a municipal bond fund for your fixed income allocation (because municipal bonds are not taxed at the federal and often state level) rather than a corporate bond fund that has a higher pre tax interest rate.
This point is so obvious, you’d think it wasn’t necessary to make. However almost every article I have read that evaluates Wealthfront’s performance compares our portfolios to ones that use the aforementioned Barclays Aggregate Bond Index for the fixed income allocation. Our portfolios should have a lower pre-tax return (the only return that is usually discussed), but a superior after-tax return (the only thing that matters).
Ignoring Tax-Loss Harvesting and Stock-level Tax-Loss Harvesting
Another major challenge of traditional attempts to evaluate your portfolio’s performance is they usually exclude the benefit you might have received from Tax-Loss Harvesting or Stock-level Tax-Loss Harvesting. That’s because very few advisors, especially ones that don’t serve very large clients, are able to provide either service.
We believe the best way to calculate the true measure of the Wealthfront service is to add the realized after-tax benefit of your harvested losses to your money weighted return. For example, if you have a $50,000 account, you earned a 5% return for the year, we harvested $1,500 of losses for the year and your total federal plus state marginal tax rate is 40%, then your tax adjusted return (money weighted return + the realized after-tax benefit of your harvested losses) would be 6.2% (5% nominal return + ($1,500 x 40%/$50,000). Assuming no net loss carry forwards, all of that return would be realized because the tax benefit from the harvested losses is less than the $3,000 ordinary income limit against which losses can be applied. Surprisingly, few of our clients add their tax-loss harvesting benefit to their money weighted returns when they compare our performance to alternatives.
Focus On What’s Under Your Control
Interestingly, the premier university endowments, the investment managers I believe are the best managers of large diversified pools of capital in the world, use the portfolio represented by the efficient frontier as their benchmark. In other words they use the equivalent of the Wealthfront portfolio as their benchmark. Now I hope you understand our challenge. How do we use a benchmark for our performance if our portfolio is the benchmark?
Rather than worry about benchmarking, for over 40 years Burt Malkiel has advised his students and readers to own a portfolio of broad asset class based index funds and maximize their outcome by focusing on the three things under their control: diversifying your portfolio, minimizing fees and minimizing taxes. It’s no surprise that we took Burt’s advice when we designed our automated investment service.
Next time one of your friends suggests you evaluate your portfolio based on the S&P 500 or a 60/40 portfolio, don’t fall for it. Neither takes risk or taxes into consideration which makes no sense given the entire goal of investing is to maximize your net of fee, after tax risk adjusted return.
Disclosure
Nothing in this blog should be construed as tax advice, a solicitation or offer, or recommendation, to buy or sell any security. Financial advisory services are only provided to investors who become Wealthfront Inc. clients pursuant to a written agreement, which investors are urged to read carefully, that is available at www.wealthfront.com. All securities involve risk and may result in some loss. For more information please visit www.wealthfront.com or see our Full Disclosure. While the data Wealthfront uses from third parties is believed to be reliable, Wealthfront does not guarantee the accuracy of the information.
The backtested hypothetical portfolio used for the Sharpe Ratio comparison is not supposed to nor does it represent any actual Wealthfront portfolio. The asset class returns used to calculate the Sharpe ratio for the hypothetical portfolio prior to 2013 are based on index total returns adjusted downwards using current expense ratios of ETFs for the corresponding asset classes. The asset class returns used from January 2013 to June 2016 are based on the actual net-of-fee ETFs returns for the respective asset classes. Backtested models have certain inherent limitations particularly the fact that such results have the benefit of hindsight and do not represent actual trading and that they may not reflect the impact that material economic and market factors might have had on an investment adviser’s decisionmaking if the investment adviser were actually managing clients’ money during the backtested period. Neither the returns on the hypothetical portfolio nor the S&P 500 used in the Sharpe ratio calculations reflect the deduction of advisory fees, brokerage or other commissions, and any other expenses that a client would have paid. The hypothetical portfolio assumes the reinvestment of dividends and other earnings. The Sharpe Ratio calculations for the hypothetical portfolio assume asset classes are rebalanced to their target weights monthly, which is different than Wealthfront’s rebalancing policies. The risk free rate used in Sharpe ratio calculation reflects the historical returns from rolling-over Treasury bills. Investments in a portfolio such as the hypothetical portfolio have the possibility of loss as well as the potential for profit. The expected returns, risk and covariance used to create the Return vs. Risk graph are based on proprietary assumptions that Wealfthfront believes provide a reasonable representation of the underlying economic quantities. Tax rates assumed in the “tax adjusted return” paragraph are based on a fairly typical Wealthfront client’s tax situation (a married couple living in California earning $260,000). The benefit from tax-loss harvesting will be lower if you live in a state with lower tax rates than California and if your joint income is lower than $260,000.
The S&P 500 (“Index”) is a product of S&P Dow Jones Indices LLC and/or its affiliates and has been licensed for use by Wealthfront. Copyright © 2016 by S&P Dow Jones Indices LLC, a subsidiary of the McGraw-Hill Companies, Inc., and/or its affiliates. An rights reserved. Redistribution, reproduction and/or photocopying in whole or in part are prohibited Index Data Services Attachment without written permission of S&P Dow Jones Indices LLC. For more information on any of S&P Dow Jones Indices LLC’s indices please visit www.spdji.com. S&P® is a registered trademark of Standard & Poor’s Financial Services LLC and Dow Jones® is a registered trademark of Dow Jones Trademark Holdings LLC. Neither S&P Dow Jones Indices LLC, Dow Jones Trademark Holdings LLC, their affiliates nor their third party licensors make any representation or warranty, express or implied, as to the ability of any index to accurately represent the asset class or market sector that it purports to represent and neither S&P Dow Jones Indices LLC, Dow Jones Trademark Holdings LLC, their affiliates nor their third party licensors shall have any liability for any errors, omissions, or interruptions of any index or the data included therein.
This blog is not intended as tax advice, and Wealthfront does not represent in any manner that the outcomes described herein will result in any particular tax consequence. Prospective investors should confer with their personal tax advisors regarding the tax consequences based on their particular circumstances. Wealthfront assumes no responsibility for the tax consequences to any investor of any transaction. Investors and their personal tax advisors are responsible for how the transactions in an account are reported to the IRS or any other taxing authority.
When Wealthfront replaces investments with “similar” investments as part of the tax-loss harvesting strategy, it is a reference to investments that are expected, but are not guaranteed, to perform similarly and that might lower an investor’s tax bill while maintaining a similar expected risk and return on the investor’s portfolio. Wealthfront assumes no responsibility to any investor for the tax consequences of any transaction.
Tax loss harvesting may generate a higher number of trades due to attempts to capture losses. There is a chance that Wealthfront trading attributed to tax loss harvesting may create capital gains and wash sales and could be subject to higher transaction costs and market impacts. In addition, tax loss harvesting strategies may produce losses, which may not be offset by sufficient gains in the account and may be limited to a $3,000 deduction against income. The utilization of losses harvested through the strategy will depend upon the recognition of capital gains in the same or a future tax period, and in addition may be subject to limitations under applicable tax laws, e.g., if there are insufficient realized gains in the tax period, the use of harvested losses may be limited to a $3,000 deduction against income and distributions. Losses harvested through the strategy that are not utilized in the tax period when recognized (e.g., because of insufficient capital gains and/or significant capital loss carryforwards), generally may be carried forward to offset future capital gains, if any.
Wealthfront’s investment strategies, including portfolio rebalancing and tax loss harvesting, can lead to high levels of trading. High levels of trading could result in (a) bid-ask spread expense; (b) trade executions that may occur at prices beyond the bid ask spread (if quantity demanded exceeds quantity available at the bid or ask); (c) trading that may adversely move prices, such that subsequent transactions occur at worse prices; (d) trading that may disqualify some dividends from qualified dividend treatment; (e) unfulfilled orders or portfolio drift, in the event that markets are disorderly or trading halts altogether; and (f) unforeseen trading errors. The performance of the new securities purchased through the tax-loss harvesting service may be better or worse than the performance of the securities that are sold for tax-loss harvesting purposes.
Wealthfront only monitors for tax-loss harvesting for accounts within Wealthfront. The client is responsible for monitoring their and their spouse’s accounts outside of Wealthfront to ensure that transactions in the same security or a substantially similar security do not create a “wash sale.” A wash sale is the sale at a loss and purchase of the same security or substantially similar security within 30 days of each other. If a wash sale transaction occurs, the IRS may disallow or defer the loss for current tax reporting purposes. More specifically, the wash sale period for any sale at a loss consists of 61 calendar days: the day of the sale, the 30 days before the sale, and the 30 days after the sale. The wash sale rule postpones losses on a sale, if replacement shares are bought around the same time.
The effectiveness of the tax-loss harvesting strategy to reduce the tax liability of the client will depend on the client’s entire tax and investment profile, including purchases and dispositions in a client’s (or client’s spouse’s) accounts outside of Wealthfront and type of investments (e.g., taxable or nontaxable) or holding period (e.g., short- term or long-term). Except as set forth below, Wealthfront will monitor only a client’s (or client’s spouse’s) Wealthfront accounts to determine if there are unrealized losses for purposes of determining whether to harvest such losses. Transactions outside of Wealthfront accounts may affect whether a loss is successfully harvested and, if so, whether that loss is usable by the client in the most efficient manner.
A client may also request that Wealthfront monitor the client’s spouse’s accounts or their IRA accounts at Wealthfront to avoid the wash sale disallowance rule. A client may request spousal monitoring online or by calling Wealthfront at 844-995-8437. If Wealthfront is monitoring multiple accounts to avoid the wash sale disallowance rule, the first taxable account to trade a security will block the other account(s) from trading in that same security for 30 days.
About the author(s)
Andy Rachleff is Wealthfront's co-founder and Executive Chairman. He serves as a member of the board of trustees and chairman of the endowment investment committee for University of Pennsylvania and as a member of the faculty at Stanford Graduate School of Business, where he teaches courses on technology entrepreneurship. Prior to Wealthfront, Andy co-founded and was general partner of Benchmark Capital, where he was responsible for investing in a number of successful companies including Equinix, Juniper Networks, and Opsware. He also spent ten years as a general partner with Merrill, Pickard, Anderson & Eyre (MPAE). Andy earned his BS from University of Pennsylvania and his MBA from Stanford Graduate School of Business. View all posts by Andy Rachleff


